UX Case Study
UX Case Study
UX Case Study
UX Case Study
UX Case Study
AWS Glue Job Monitoring Dashboard
AWS Glue, 2020
Monitoring dashboard for AWS Glue ETL pipelines
PROBLEM OVERVIEW
PROJECT OVERVIEW
PROJECT Overview
AWS Glue is a managed ETL service used by data engineering teams to build and operate data pipelines at scale. When I joined the Glue Studio team, customers had no native way to monitor their jobs comprehensively. They were building their own dashboards just to answer basic operational questions: what ran, what failed, and why.
I led design and research for the job run monitoring dashboard, a purpose-built view that gave data engineers visibility into pipeline health, resource utilization, and failure patterns across all their Glue jobs.
Interactive prototype
I built an interactive prototype, using the Cloudscape Design System and Claude Code to demonstrate functional fidelity.
In the prototype, you'll be able to go through each screen of the experience and interact with the data and dashboards. For technical details, view the ReadMe on my Github.
Note: This is a functional prototype. The goal is to demonstrate interaction patterns and design decisions, not production-ready code.
Customer problem and goal
During a customer feedback call, a Director of Engineering at GHX walked me through a monitoring dashboard his team had built from scratch. His data engineers needed a way to track job run health across their data integration pipelines, and nothing in the AWS console gave them that capability. So they built it themselves.
That conversation made the problem concrete. When customers are spending engineering time to fill a gap in your product, the gap is real.
The goal was straightforward: give data engineers a single place to understand what is running, what failed, when failures tend to happen, and how pipeline performance is trending over time, without leaving AWS Glue.
Who I designed for
DATA ENGINEERS

Data engineers are responsible for building, operating, and troubleshooting ETL pipelines. Their day starts with a question: did everything run last night? They need fast answers, not more dashboards to build.
Design overview
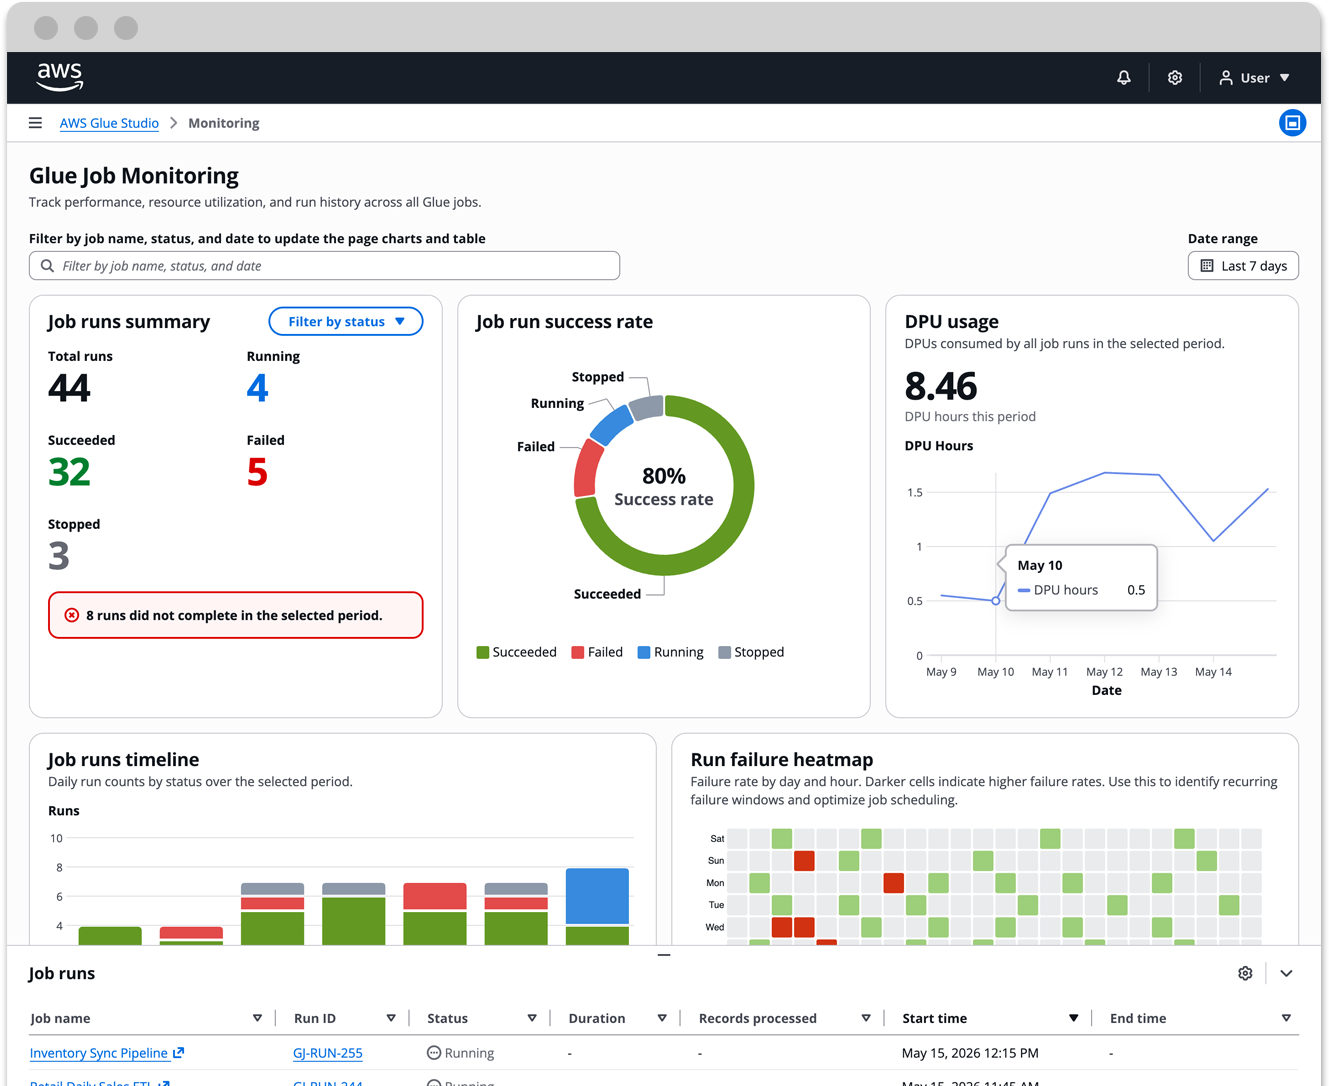
The dashboard is organized around two levels of visibility: the overall health of all jobs, and the details of a specific run.
Property filters
The property filters on the top of the dashboard can segment cohorts of job name, run status, and date. It can then display that data throughout the charts and job runs table on the dashboard. This lets an engineer go from "something failed on Thursday" to a filtered view of exactly those runs in a few clicks.
Summary cards
The three summary cards give an immediate read on run counts by status. A donut chart shows the success rate at a glance. A DPU sparkline shows resource consumption trending over the selected period.
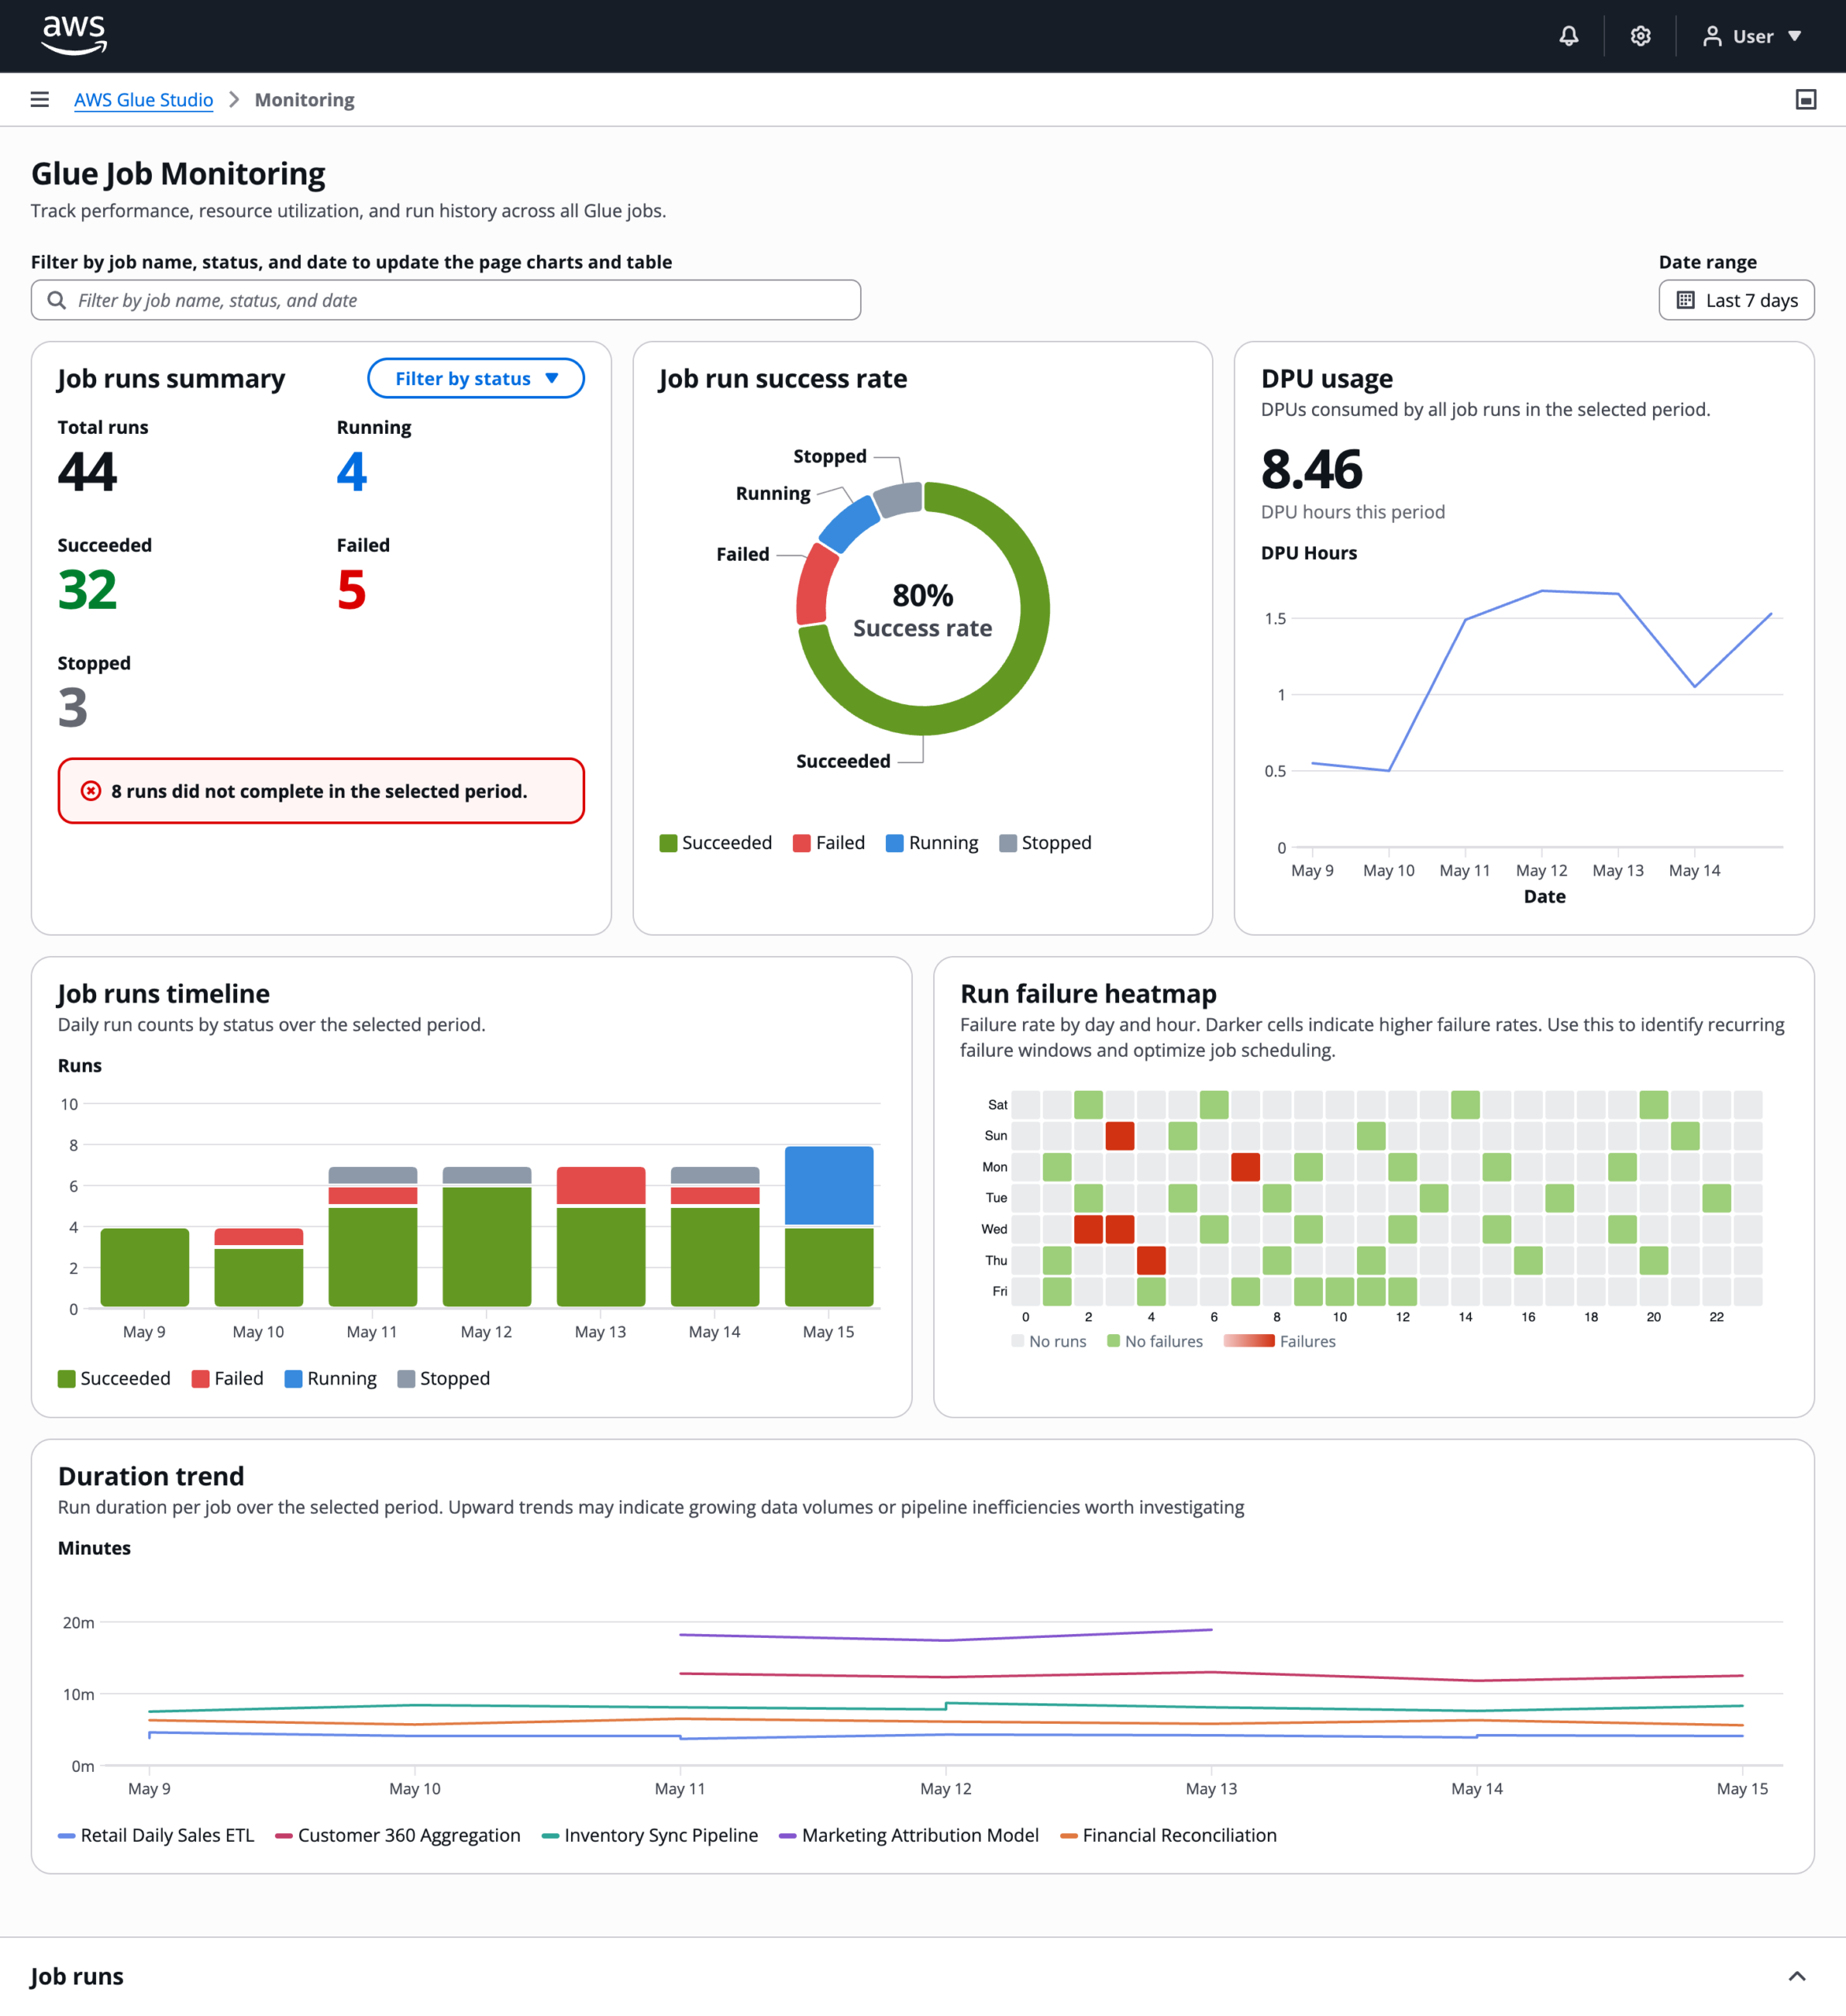
Job runs timeline
The job runs timeline is a stacked bar chart showing daily run counts broken down by status.
Run failure heatmap
The failure heatmap is the most differentiated element. It maps failure rate across days of the week and hours of the day. Darker cells mean higher failure rates. The pattern it surfaces is the kind engineers can act on: if failures cluster at 3 AM on weekdays, that is a scheduling or dependency problem, not a random error.
Duration trend
The duration trend chart tracks run time per job over the selected period. A job that used to take four minutes and now takes twelve is telling you something changed, either in the data volume or the pipeline itself.
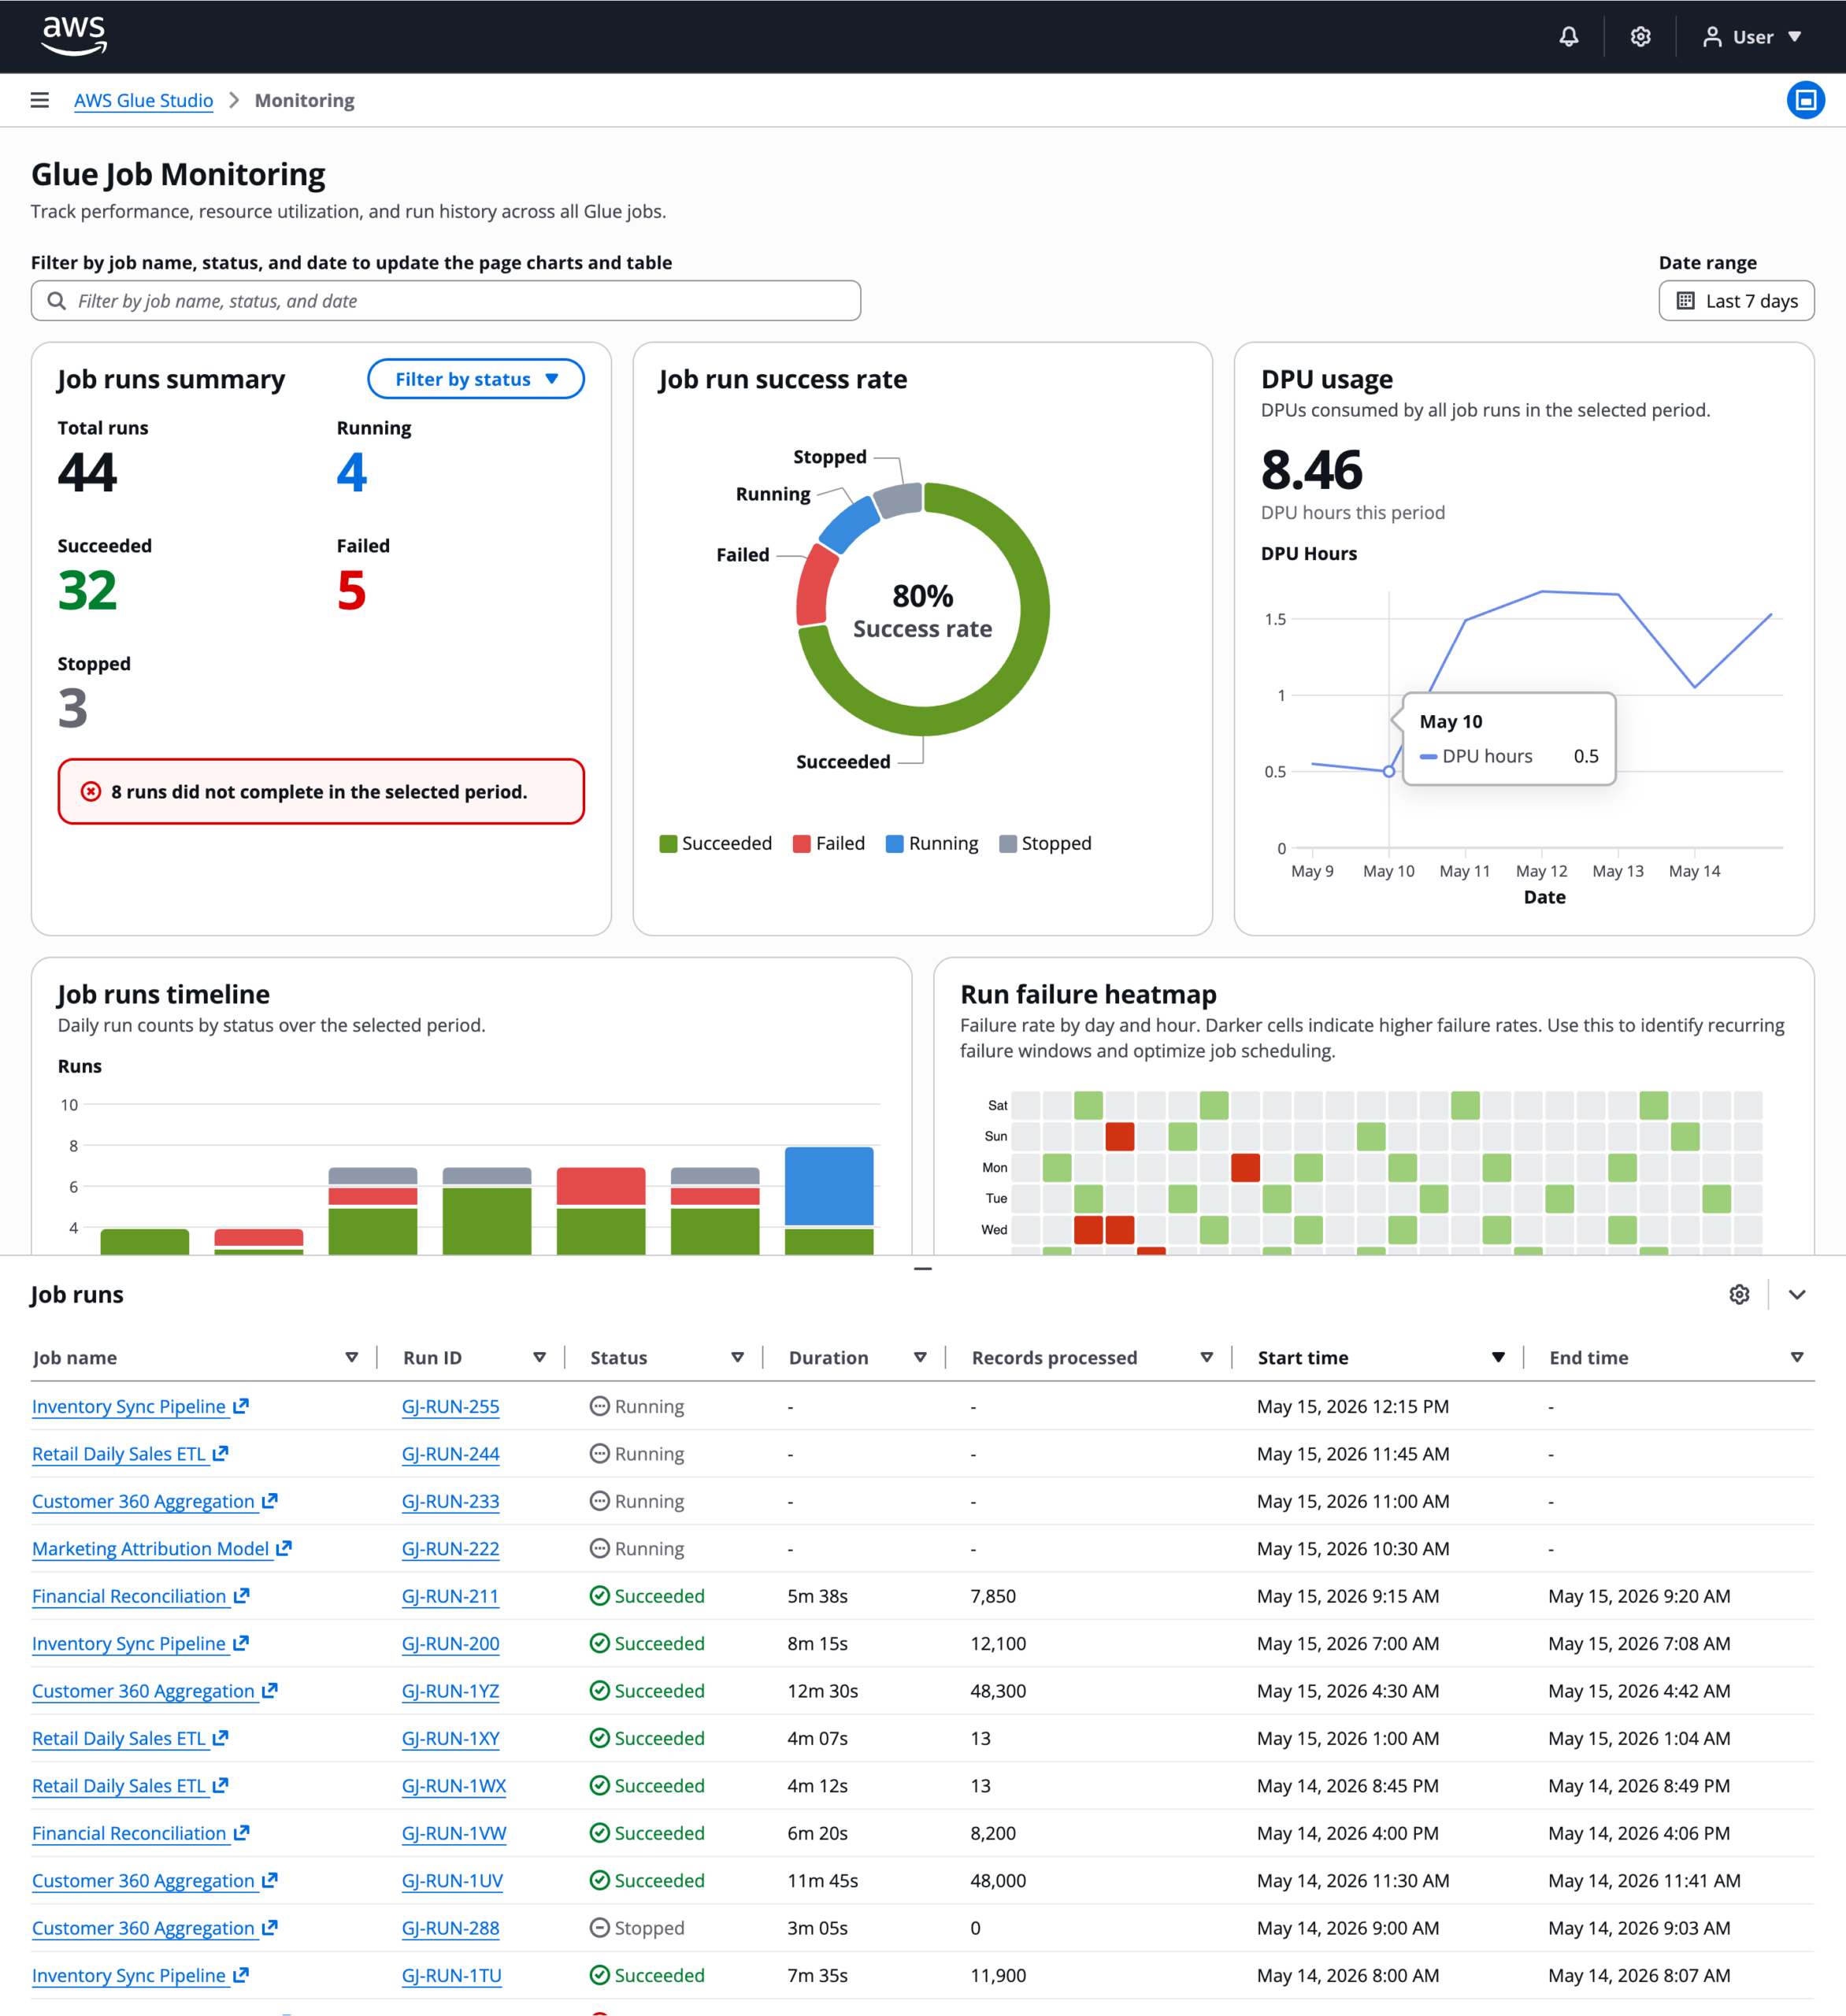
Job runs panel
The job runs table lives in a resizable split panel at the bottom of the page. A global property filter at the top of the page drives the table and all charts simultaneously. Selecting a row enables a "View run details" button that navigates to a node-level breakdown of that specific run.
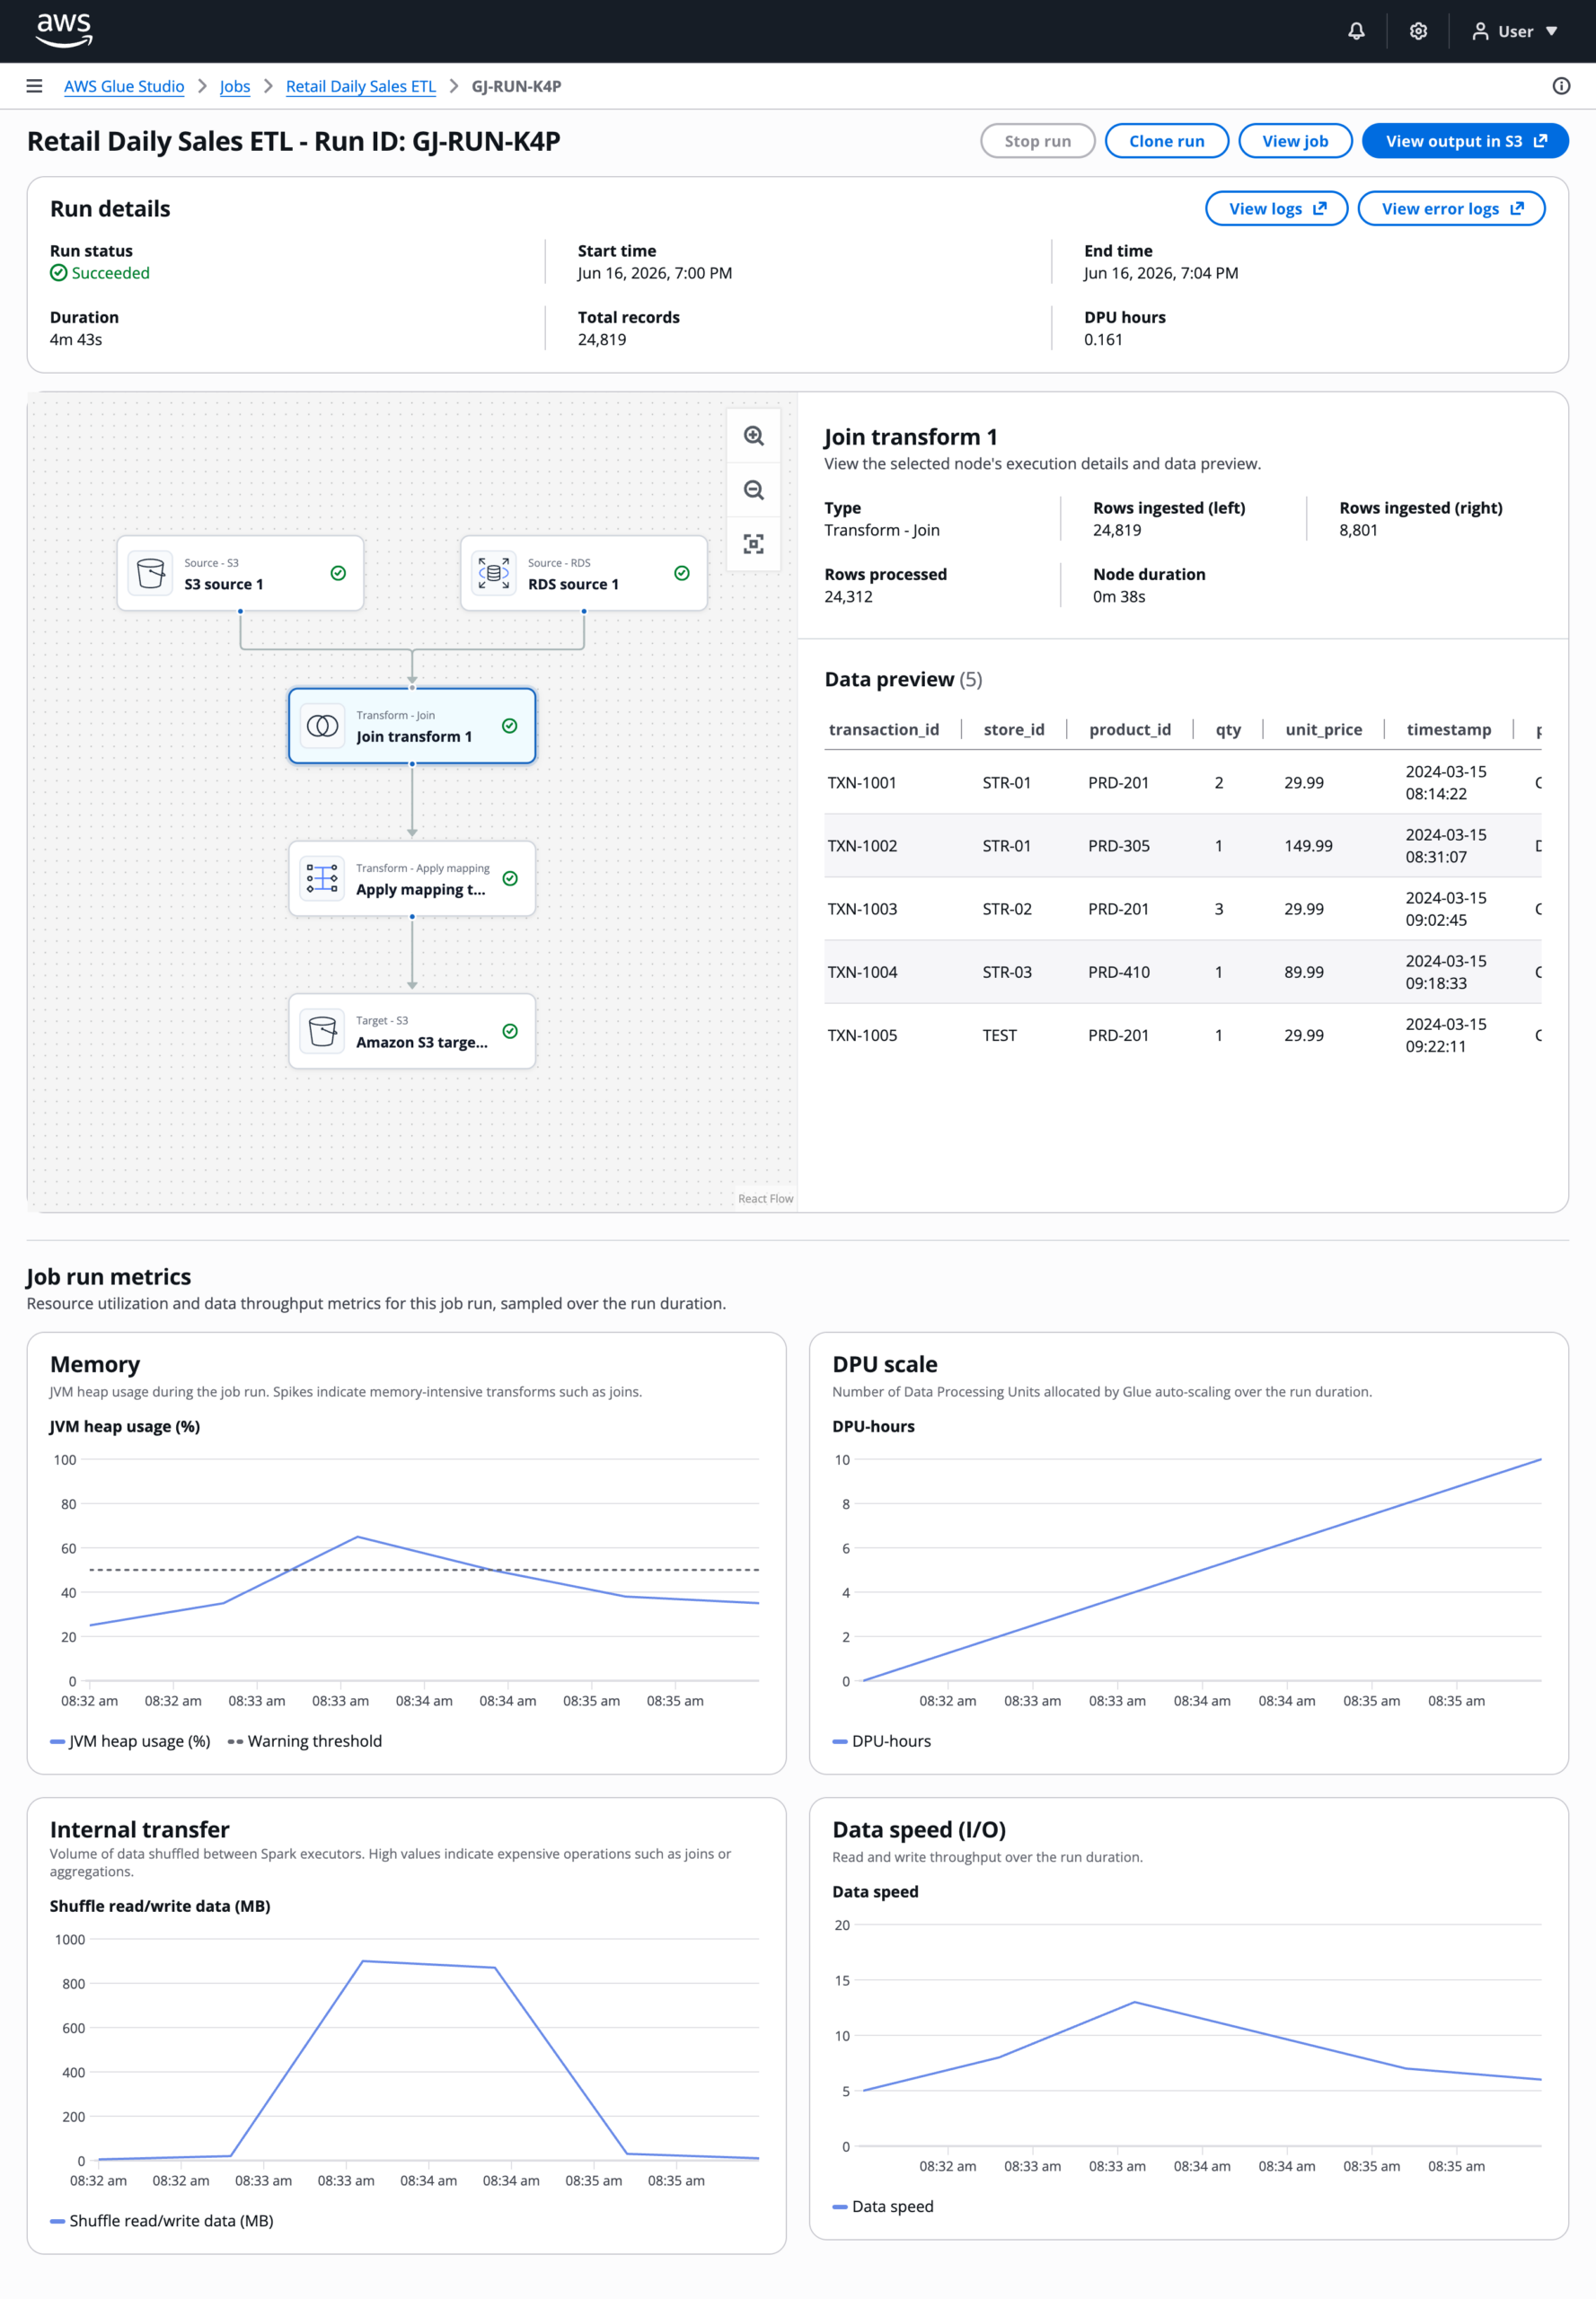
Run details page
The run details provide a snapshot of the job configuration, a live data flow visualization, time-series performance metrics, and direct links to CloudWatch logs for deep troubleshooting.
Outcome
The monitoring dashboard shipped as part of Glue Studio in Q1 of 2020. In the six months following the release, Glue Studio saw significant growth in adoption across the customer base.
Portfolio
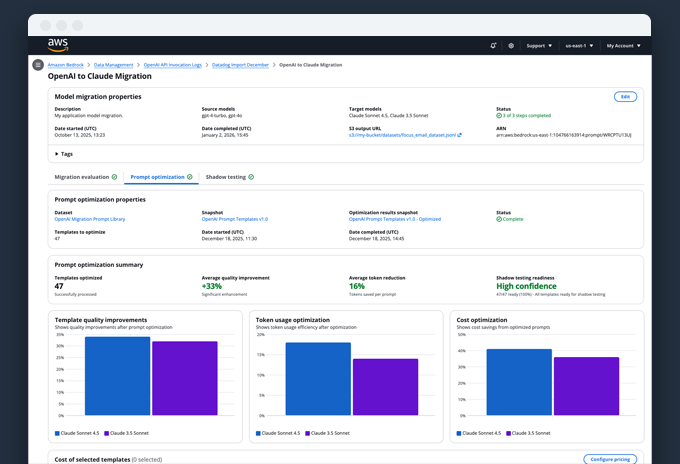
Model Migration as a Lifecycle ProblemEnabling enterprises to migrate models without losing trust, quality, or control
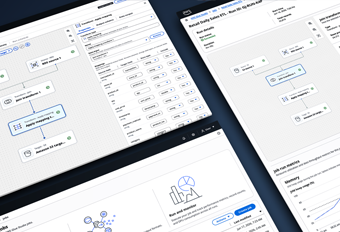
AWS Glue StudioDesigning a configuration-driven data pipeline builder for enterprise scale
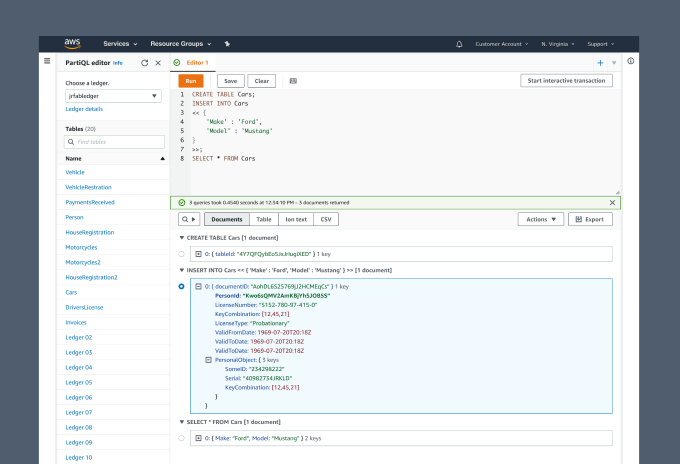
PartiQL Editor for Amazon QLDBUX Case Study
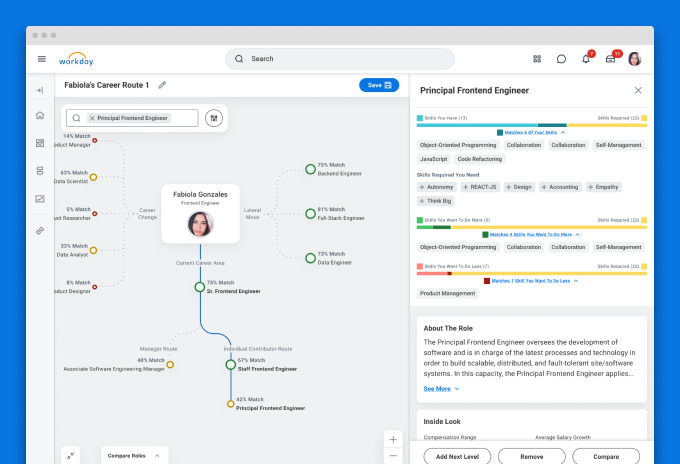
Career exploration for Workday's Career HubDesigning AI-assisted career exploration with human judgment at the center
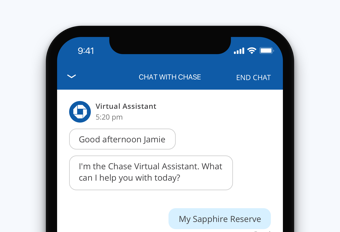
Enhanced chat for Chase mobileUI-UX design
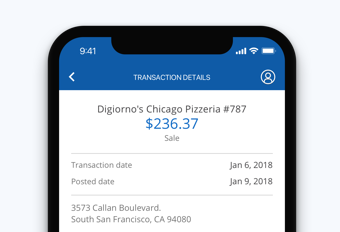
Transaction details for Chase mobileUX Case study

UI for James Bond 007: World of espionageDesign system
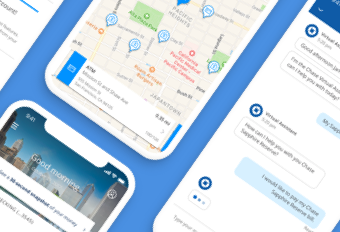
Chase mobileUI-UX Design