OVERVIEW
AWS Glue Studio is a cloud analytics application to create data integration pipelines and monitor their performance. Prior to Glue Studio, AWS customers could only hand code to create these pipelines using an external IDE. However, customers also wanted a visual UI to build pipelines because they needed an easier way to do it in order to save costs. My role was to own the UX research, strategy, and design of this product.
Overview
AWS Glue Studio is a cloud analytics application to create data integration pipelines and monitor their performance. Prior to Glue Studio, AWS customers could only hand code to create these pipelines using an external IDE. However, customers also wanted a visual UI to build pipelines because they needed an easier way to do it in order to save costs. My role was to own the UX research, strategy, and design of this product.
Key takeaways
WORKING IN AMBIGUITY
Coming into this project, I wasn’t familiar with data integration, data preparation and the analytics domain. I really had to dive deep to understand my customers and the complex problem I was solving.
OWNERSHIP
From concept to release, I worked as the only UX designer on this product on a newly formed development team with little precedent to build on. I researched and defined the UX foundation outlined in this case study for this product.
WORKING WITH A HUGE SCALE
The scope of this product is huge, initially being an application to visually create and monitor data integration pipelines. It is constantly adapting through customer and business needs and I continue to balance those needs with the project roadmap and limited resources. The ultimate goal is to make Glue Studio the "one-stop shop" for data integration pipeline authoring for AWS users.
Understanding the domain
WHAT IS A DATA INTEGRATION PIPELINE?
It is extracting raw data from one or multiple sources. Then, perfoming transforms with it to clean and normalize it before loading it into a data warehouse or data lake for analytics and business reports.
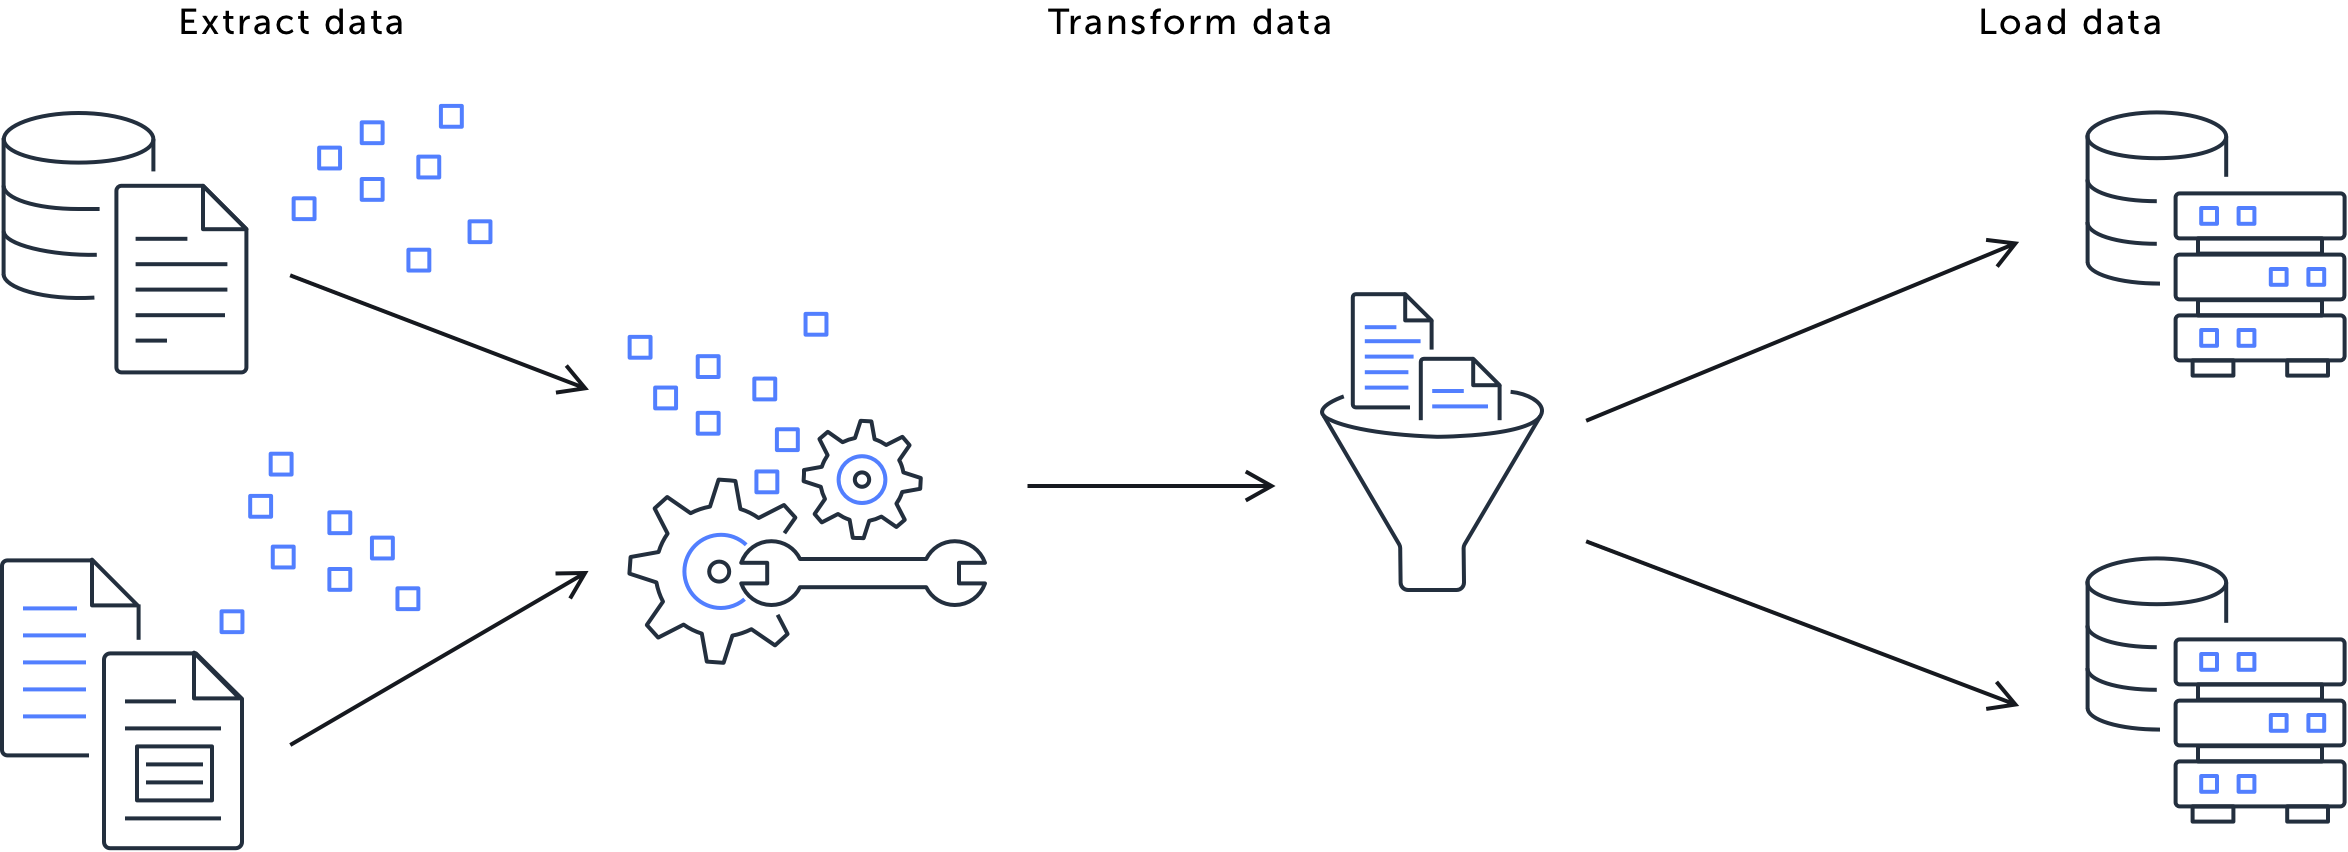
It is a collaborative, non-linear, and iterative process, involving different personas in the data analytics space.
HOW DO CUSTOMERS MAKE DATA PIPELINES?
A group consisting of a Data Engineer, Data Scientist, and/or Data Analyst work together to create them. They model and code this process with the AWS Glue API, typically using a preferred IDE (Interactive development environment).
Understanding the customers
WHAT DO CUSTOMERS WANT?
Customers want a visual way to create data integration pipelines because they’re not always strong coders and there are cases where writing the code is tedious and error-prone.
Customers want to lower the learning curve and to minimize set-up requirements because they can’t immediately start building their pipelines. Sometimes, my target users aren’t even familiar with the frameworks or set-up required.
Customers want better debugging tools at both the authoring and production stages because the existing AWS tools aren’t sufficient.
WHO ARE THE CUSTOMERS?
Data Engineer
ROLES AND DUTIES
Design and build data integration pipelines to clean and aggregate data
Create and share parameterized pipeline templates with stakeholders
PIPELINE DEVELOPMENT SKILL
Expert level
Data Scientist
ROLES AND DUTIES
Data modeling and production using prototypes, algorithms, predictive models, and custom analysis
Build data integration pipelines of basic to intermediate complexity
Share work with stakeholders both technical and non-tech
PIPELINE DEVELOPMENT SKILL
Intermediate level
Data Analyst
ROLES AND DUTIES
Examine data to identify trends and build charts
Build data integration pipelines of basic complexity
Present findings for making strategic business decisions
PIPELINE DEVELOPMENT SKILL
Basic level
WHAT IS THE CUSTOMER JOURNEY?
Stage 1: Data Exploration
This is the beginning of the journey where customers are collaborating doing initial data analysis and preparing it for the pipeline creation.
VALUE OPPORTUNITY
Allow customers easy access of AWS data exploration products and data sources as well as third-party data sources.
Stage 2: Data Preparation
The most iterative and time-intensive part of the journey. Customers are building their pipelines with the Glue API. It involves cleaning, aggregating, and standardizing the data.
VALUE OPPORTUNITY
Provide customers with a visual way to autogenerate the code for creating data integration pipelines.
Stage 3: Data Validation
This stage is recurring. It involves viewing sample data, examining their pipelines, and determining if the result is correct, adapting where necessary.
VALUE OPPORTUNITY
Provide data previews for data debugging at the authoring level and offer dashboards to monitor health and performance of the pipelines.
Stage 4: Production & Management
This is the last stage of the customer journey where the pipelines are deployed to production and the final data is ready for analytics and business reports.
VALUE OPPORTUNITY
Improve existing tools for data integration pipeline management and orchestration.
Design strategy
WHAT ARE CUSTOMER EXPECTATIONS?
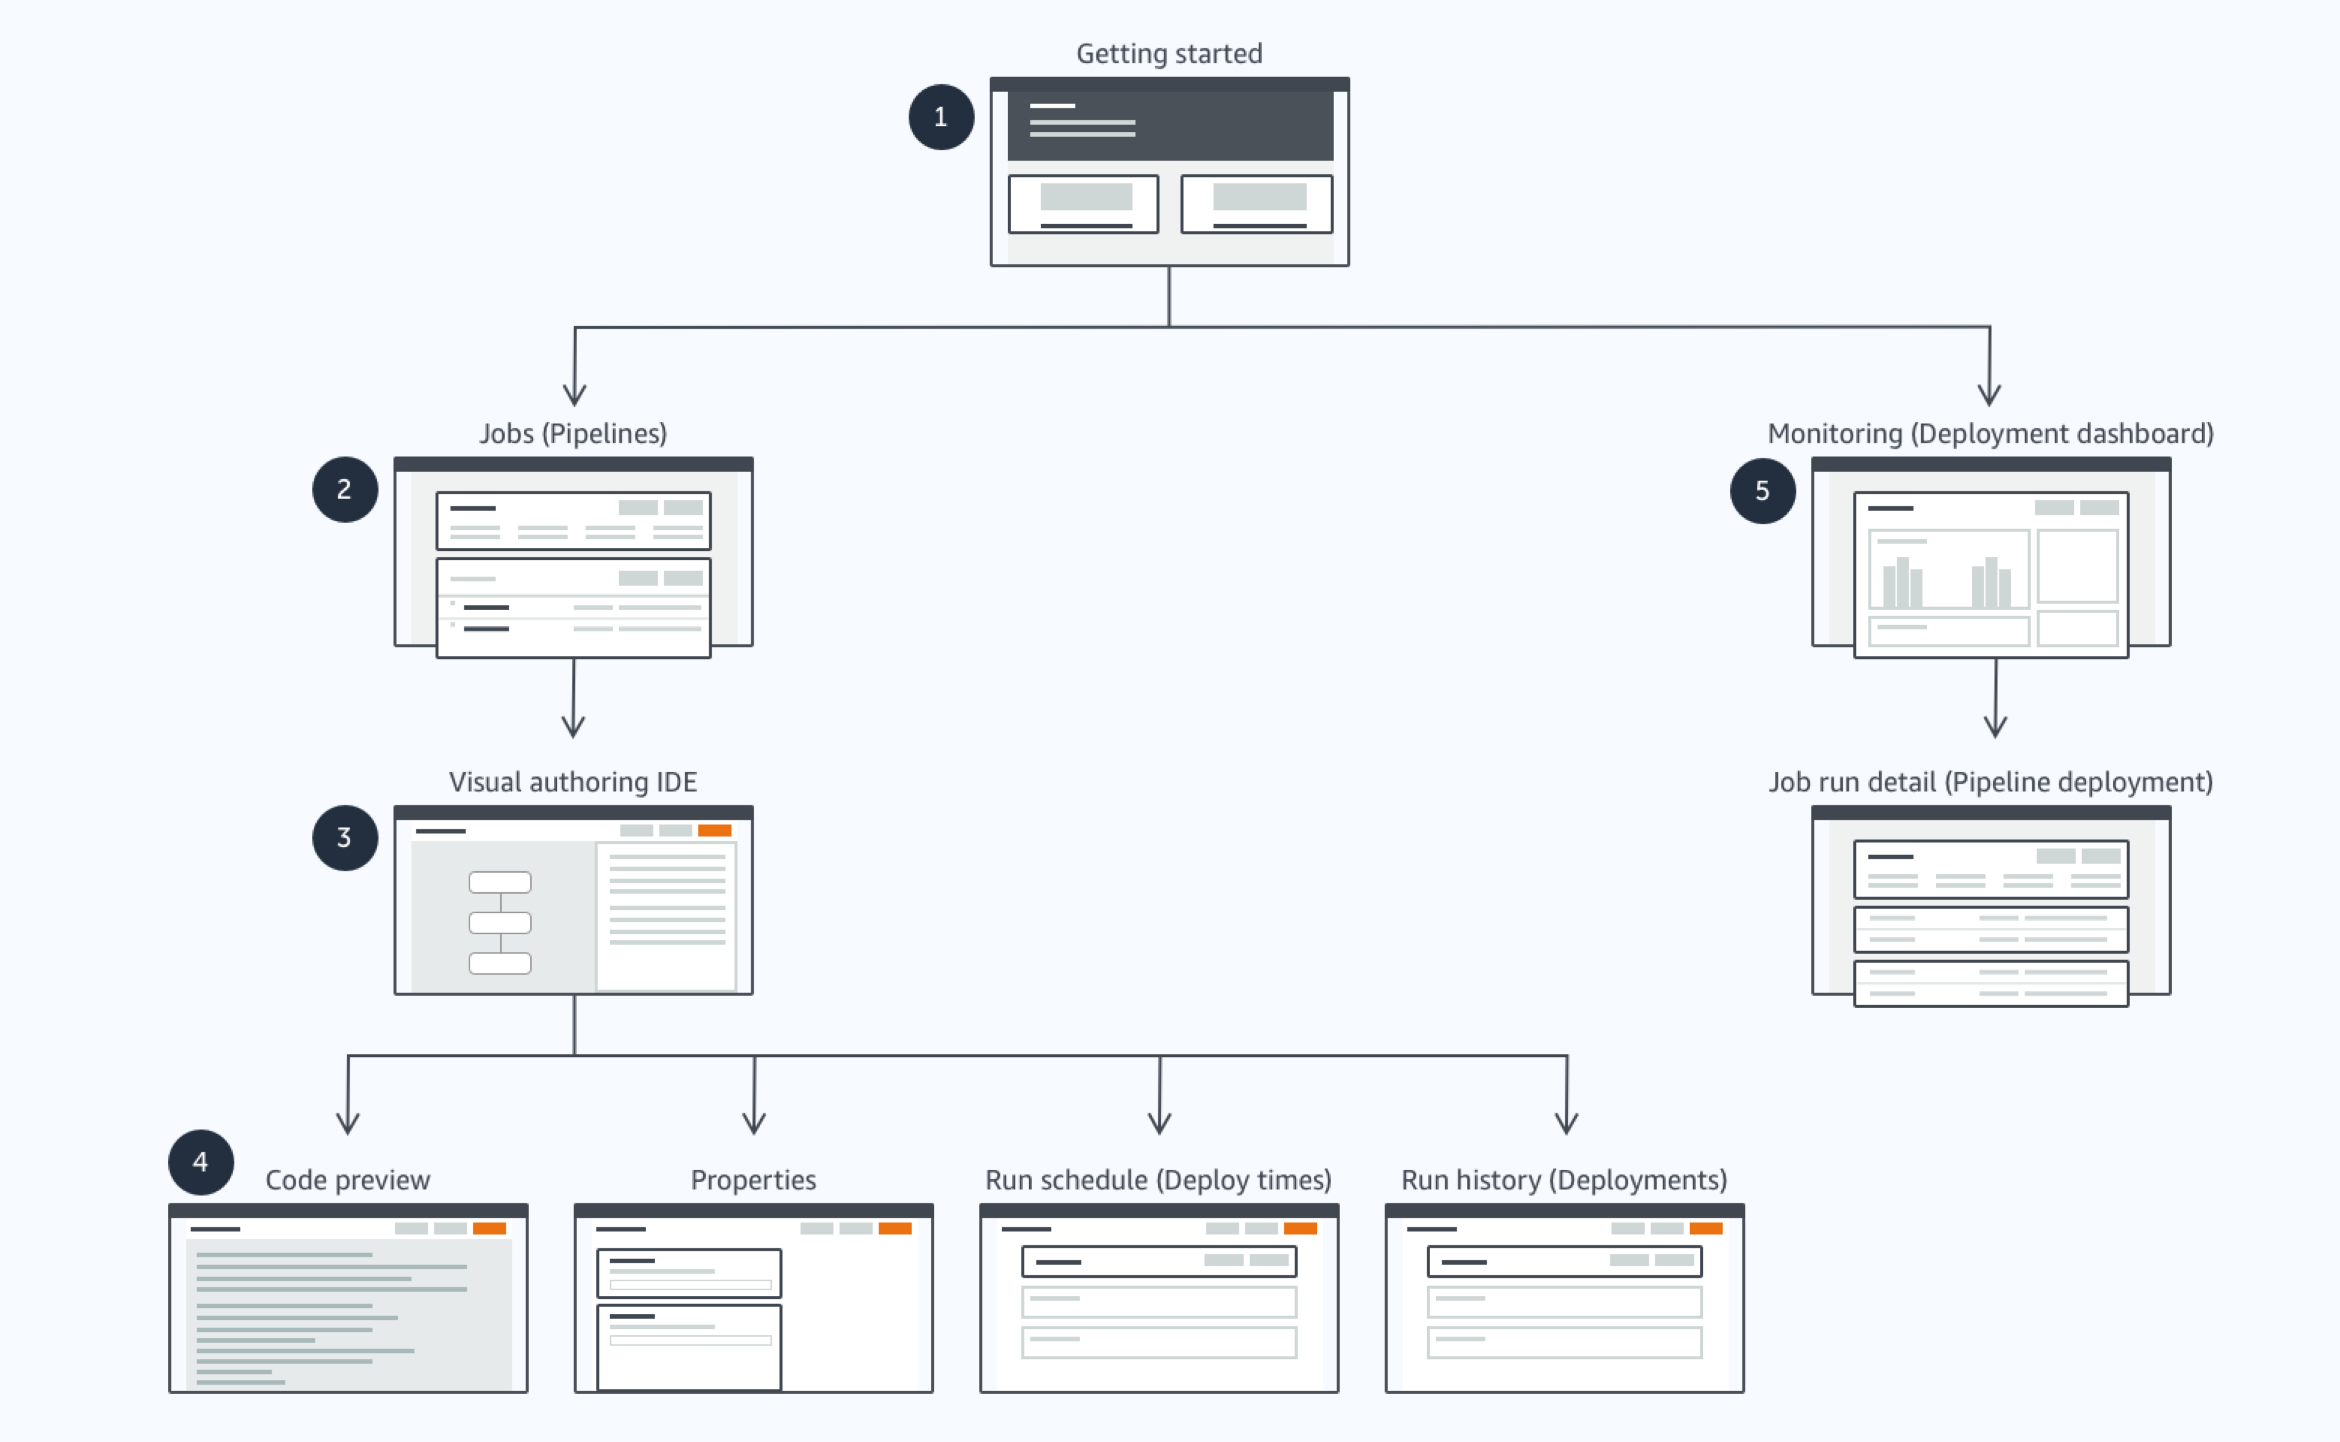
Customers contextualize these data pipelines as a “boxes-and-arrows” graph. They expect a visual, IDE-like authoring experience to create them. They want to easily access their data sources, contextualize and preview data while building pipelines, deploy them, and monitor their performance.
INFORMATION ARCHITECTURE
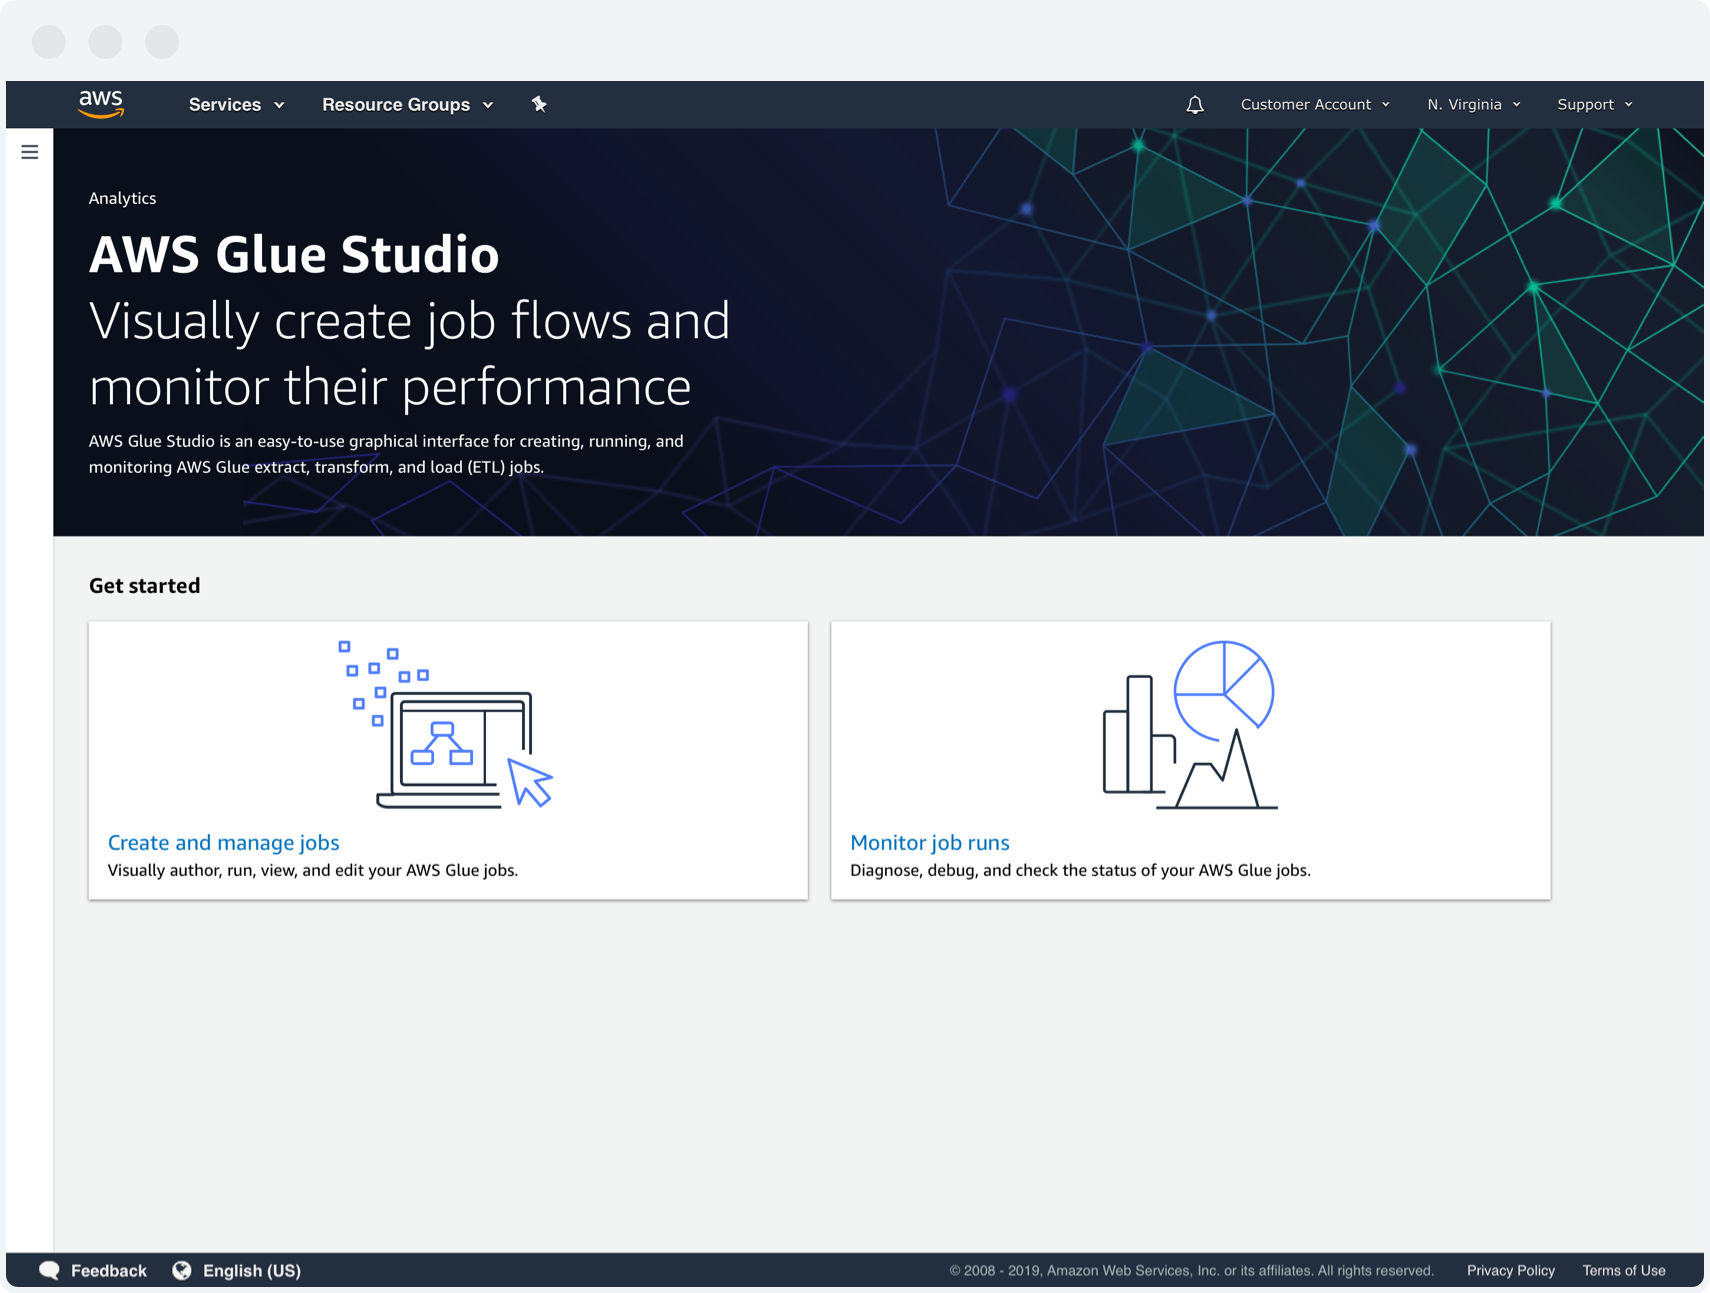
1. Getting started
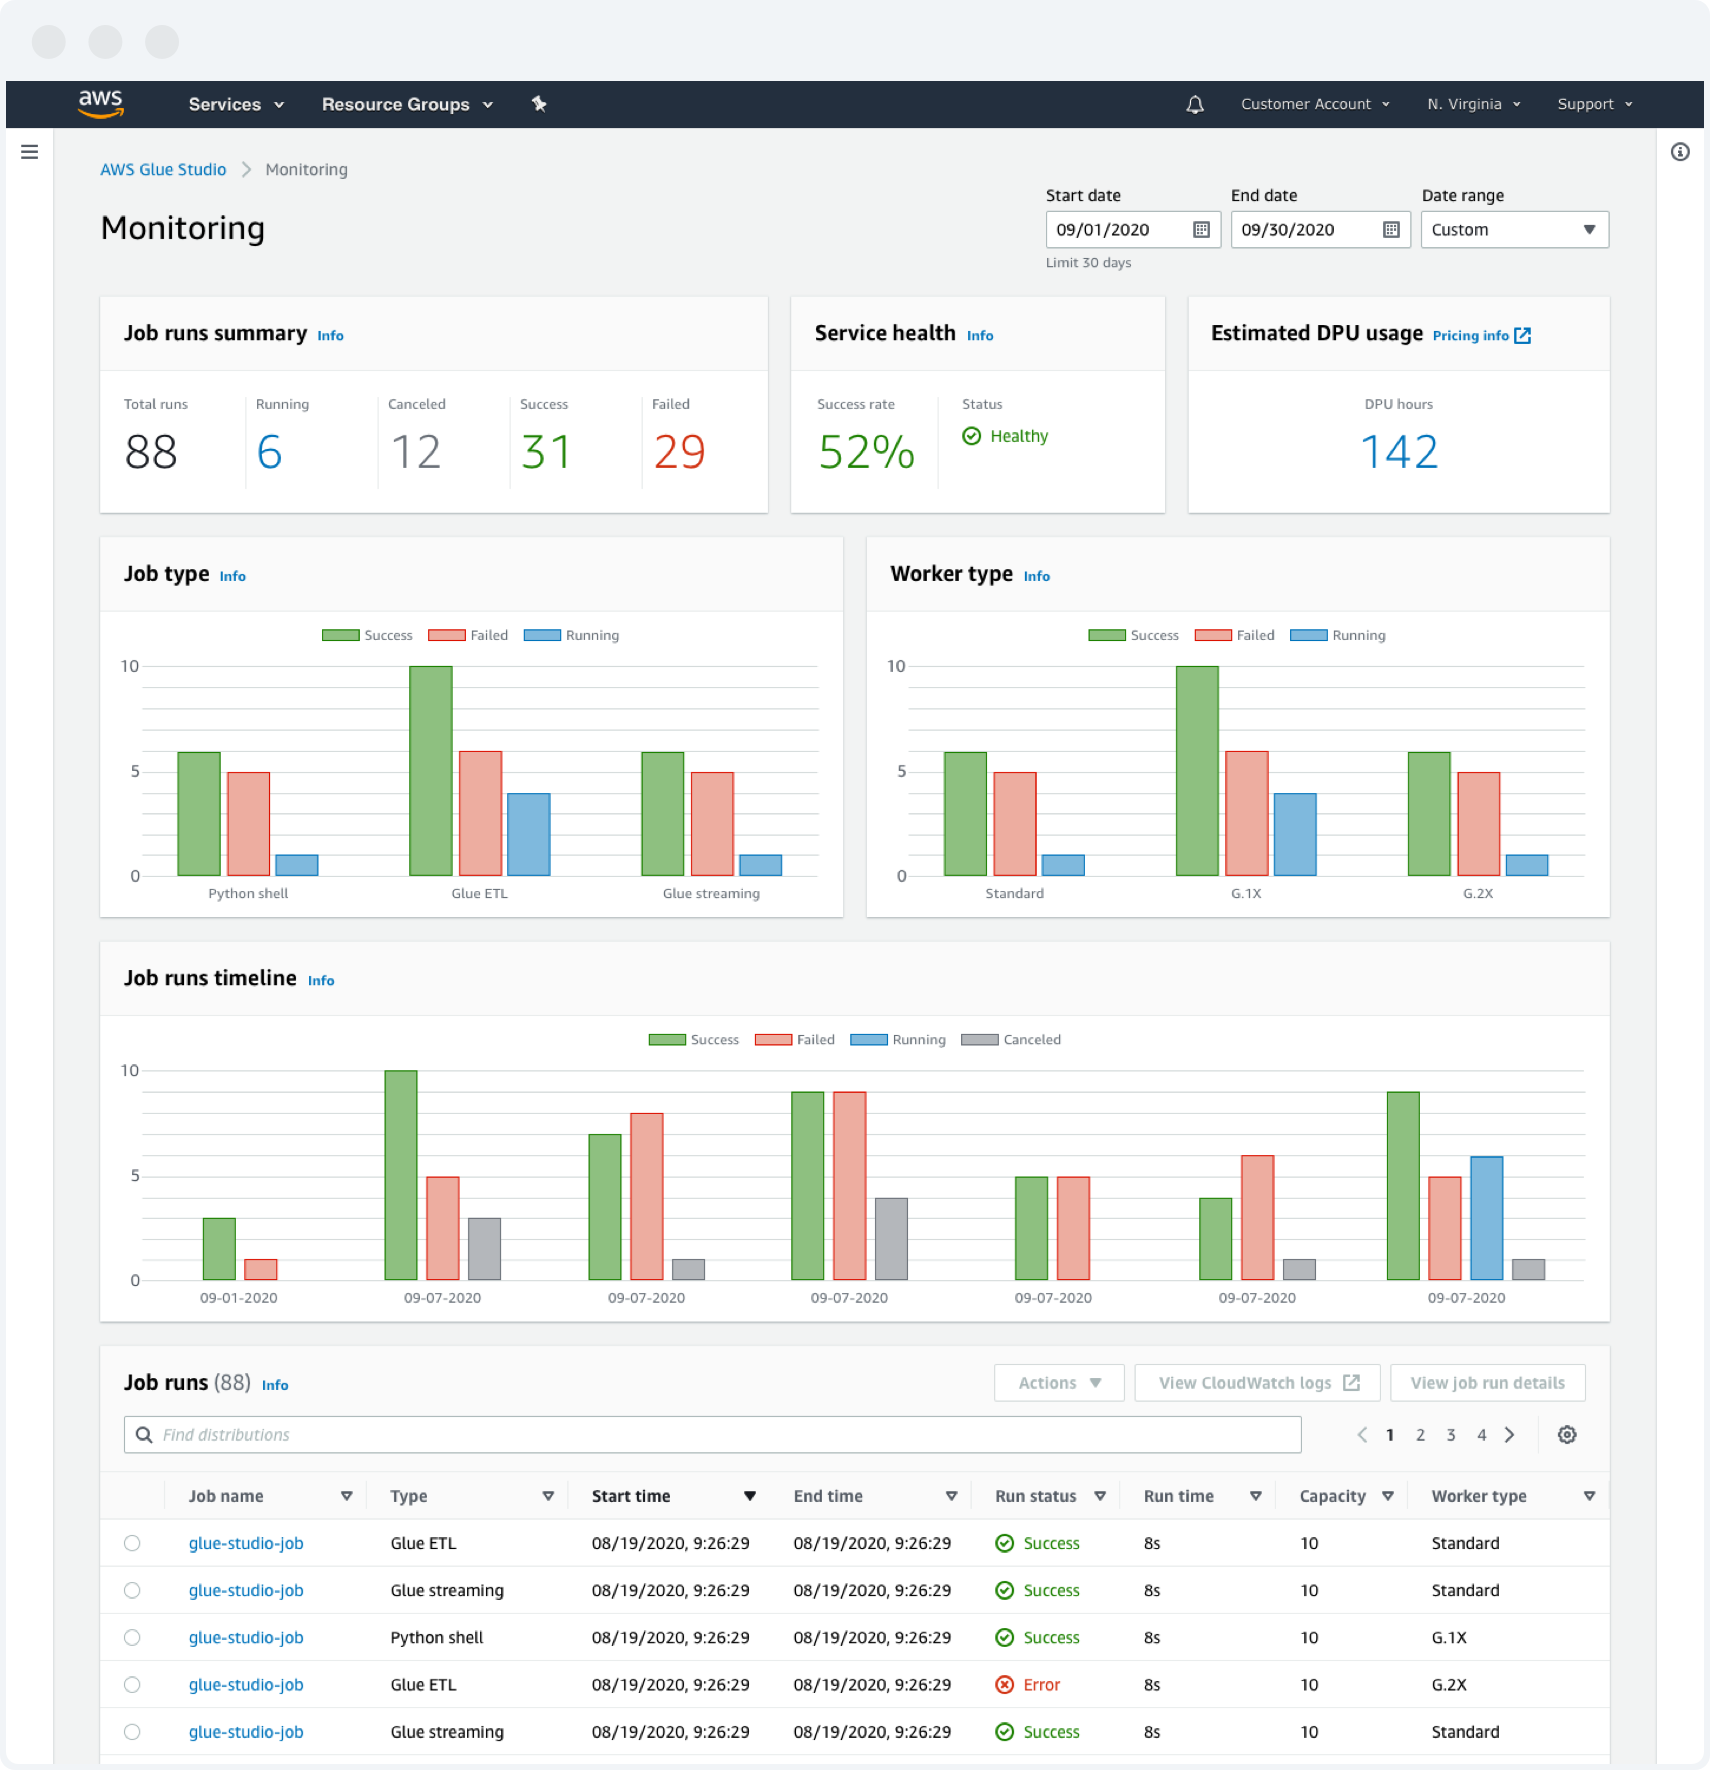
This is the first screen customers would see upon entering from the AWS console. In AWS Glue, data integration pipelines are branded as “Glue jobs” and deployments are called “Glue job runs.” The screen’s highlighted actions signal the two most frequent things a customer would do in Glue Studio: “Create and manage jobs” and “Monitor job runs.”
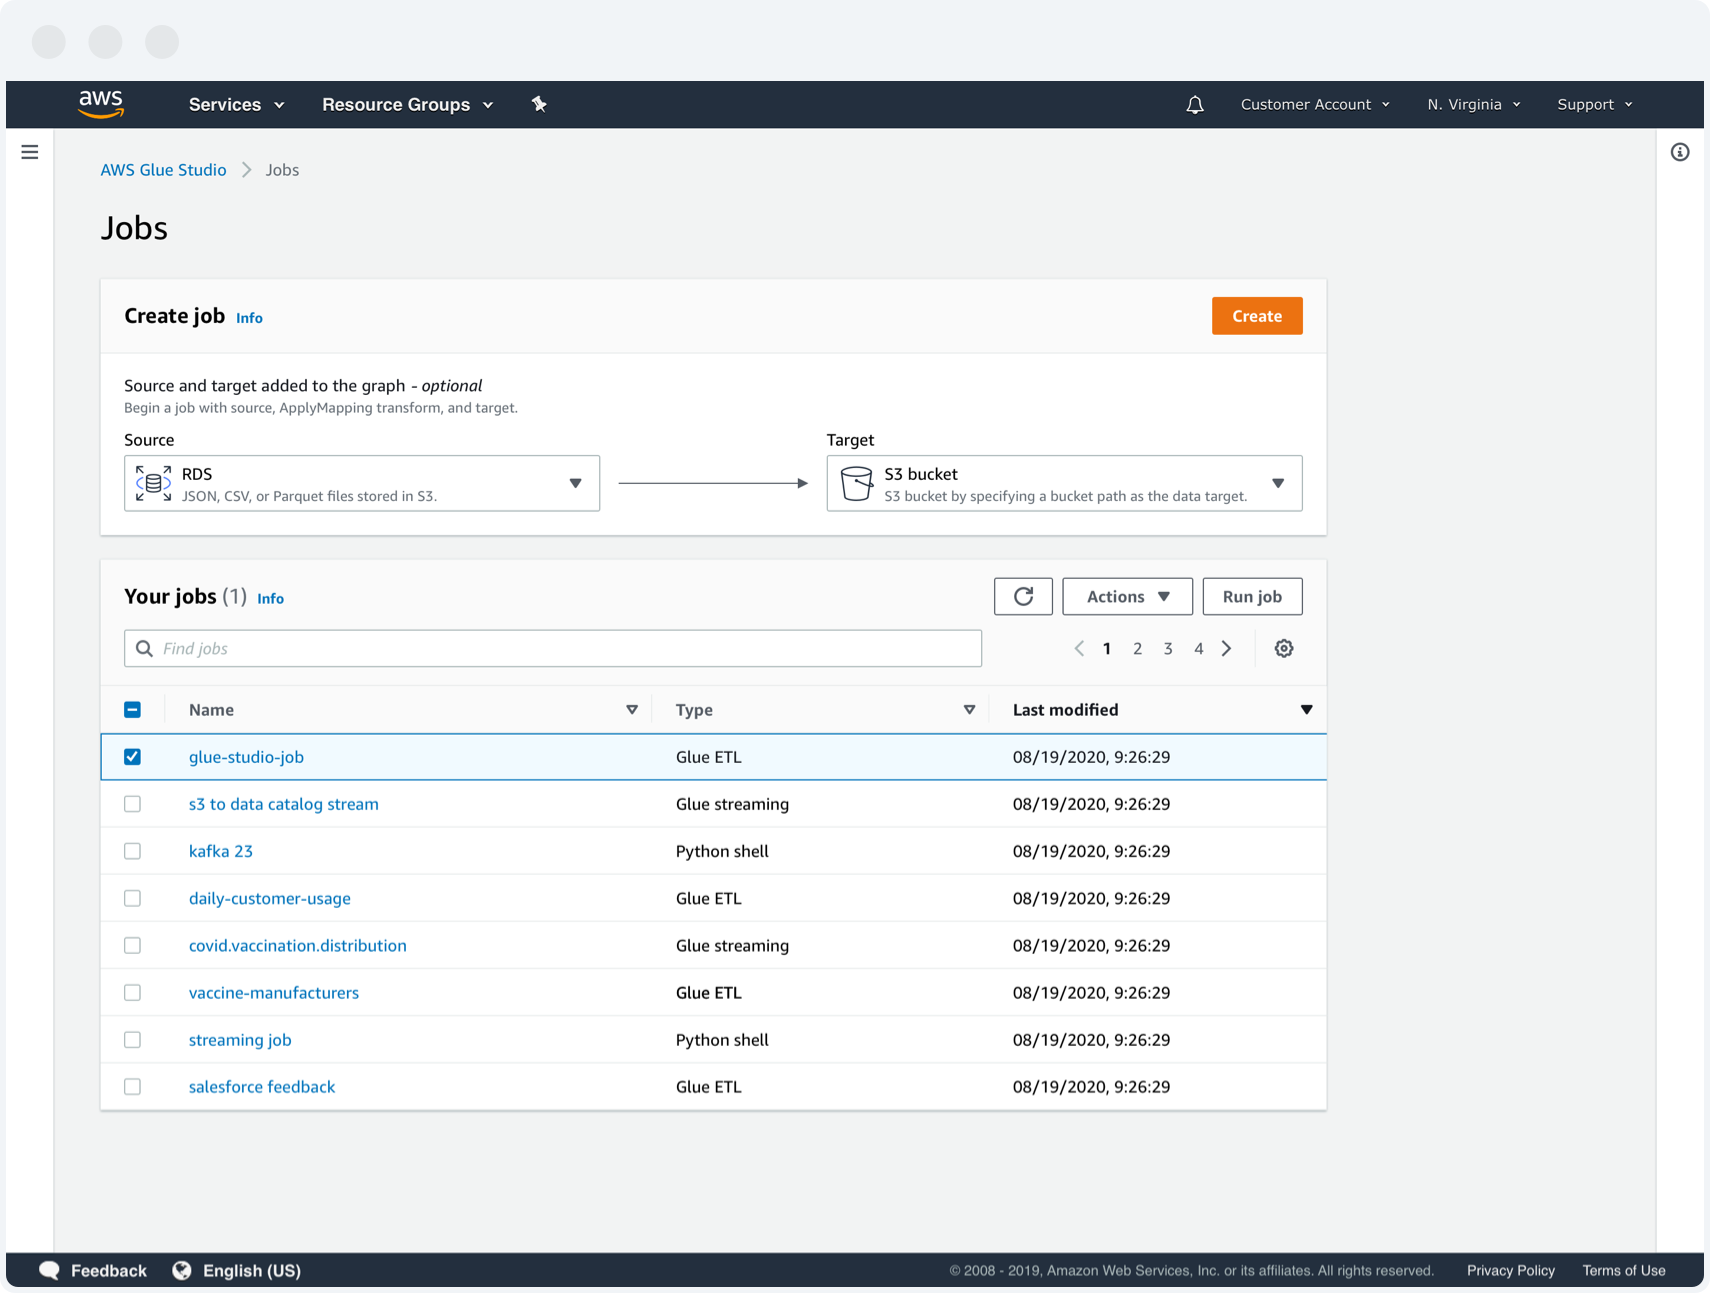
2. Jobs (Pipelines)
Customers can view and manage a list of all the Glue jobs in production. They can also easily create a new job with little set-up or prequisites to begin their work.
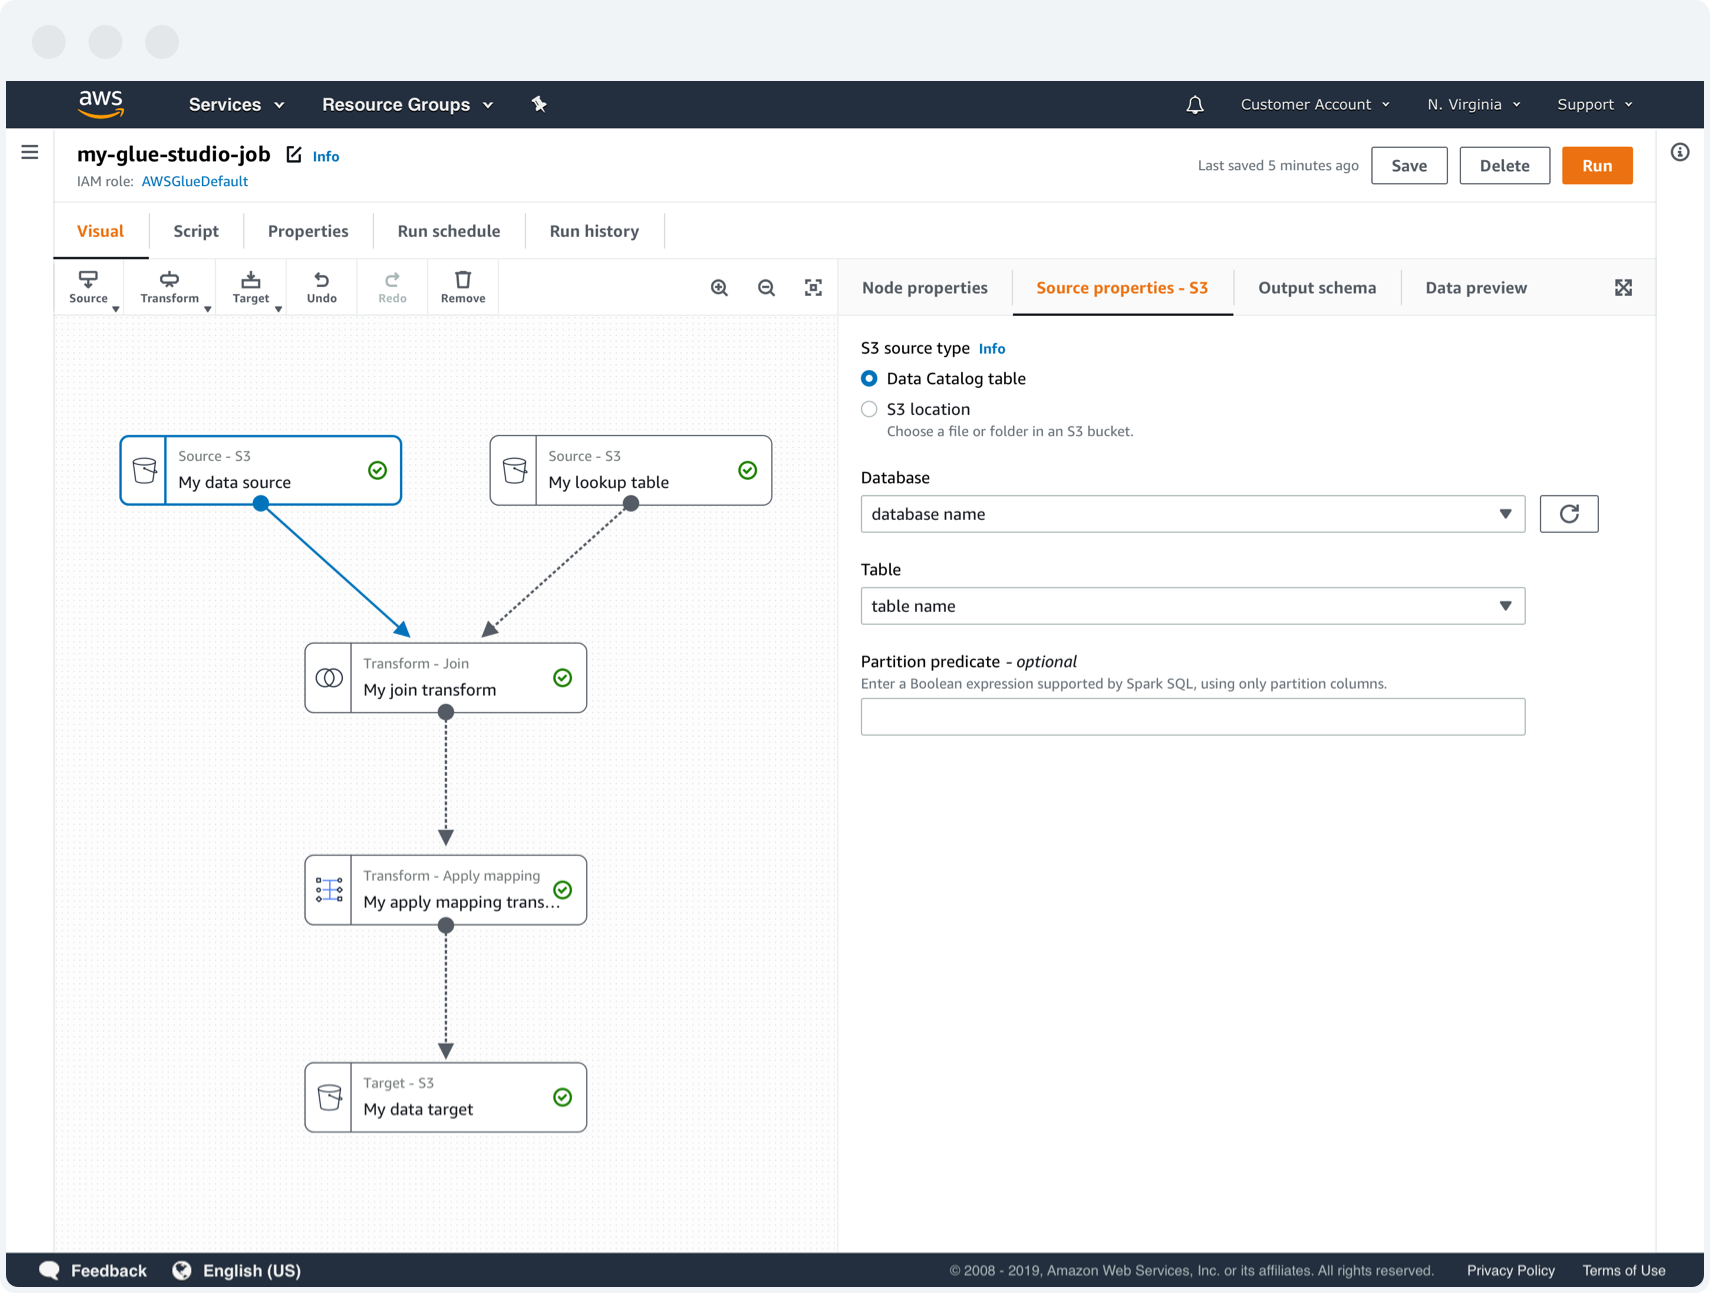
3. Visual authoring IDE
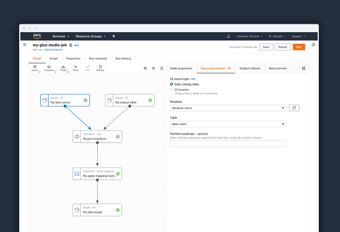
The visual authoring tool is where customers can build their Glue jobs in a “boxes and arrows” graphing environment. There is a fully interactive graph where users can add and connect boxes representing data sources, transforms, and data targets. For each box in the graph, customers can perform data preparation and validation to their Glue job, saving them time and money. Deep dive into Visual authoring interface for AWS Glue Studio
4. Code preview
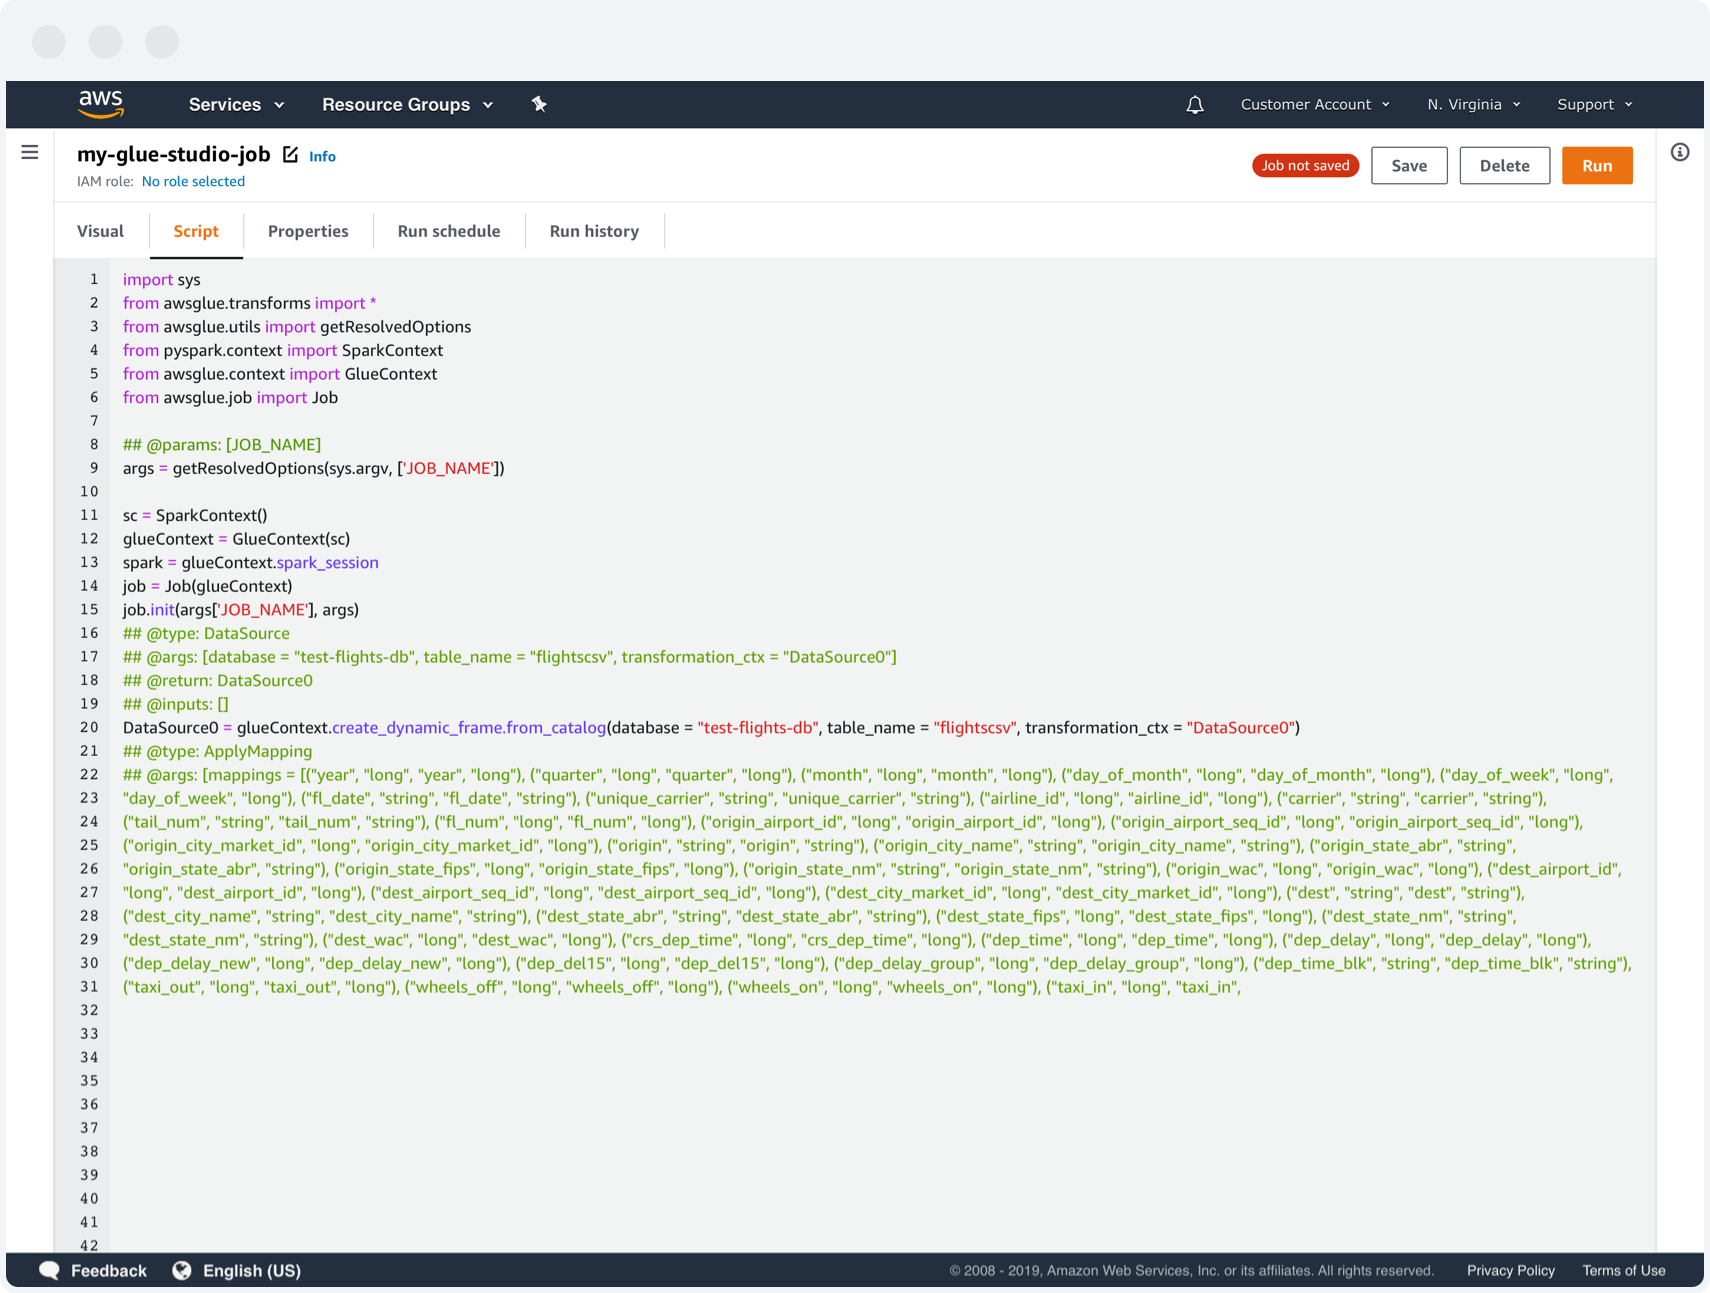
This is a subsection of the visual authoring IDE for previewing the auto-generated code of the Glue job being built. Customers can copy this code into an external editor in case they want to do more advanced functions not available in Glue Studio.
Key Results
Following the product's release, AWS Glue saw a significant increase in both usage and revenue. The UX foundation I developed continues to drive Glue Studio's ongoing enhancements, introducing features for data exploration, preparation, validation, and production.
Portfolio
Career exploration for Workday's Career HubProduct Design
Real-Time AI AlertsData Visualization
Visual authoring interface for AWS Glue StudioUX Case Study
Asurion Virtual AgentUI Design

Chase mobileUI-UX Design
Enhanced chat for Chase mobileUI-UX design
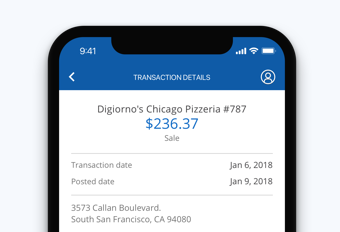
Transaction details for Chase mobileUX Case study

Upgrade systems for Rival FireUX case study
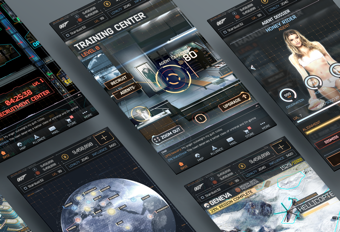
UI for James Bond 007: World of espionageDesign system
